10-Year Treasury Constant Maturity Minus 2-Year Treasury Constant Maturity
| 2024-04-17 / Daily / Percent
Starting with the update on June 21, 2019, the Treasury bond data used in calculating interest rate spreads is obtained directly from the U.S. Treasury Department (https://www.treasury.gov/resource-center/data-chart-center/interest-rates/Pages/TextView.aspx?data=yield).
Series is calculated as the spread between 10-Year Treasury Constant Maturity (BC_10YEAR) and 2-Year Treasury Constant Maturity (BC_2YEAR). Both underlying series are published at the U.S. Treasury Department (https://www.treasury.gov/resource-center/data-chart-center/interest-rates/Pages/TextView.aspx?data=yield). |
 |
30-Year Fixed Rate Mortgage Average in the United States
| 2024-04-18 / Weekly, Ending Thursday / Percent
On November 17, 2022, Freddie Mac changed the methodology of the Primary Mortgage Market Survey® (PMMS®). The weekly mortgage rate is now based on applications submitted to Freddie Mac from lenders across the country. For more information regarding Freddie Mac’s enhancement, see their research note (https://www.freddiemac.com/research/insight/20221103-freddie-macs-newly-enhanced-mortgage-rate-survey).
Data are provided “as is” by Freddie Mac®, with no warranties of any kind, express or implied, including but not limited to warranties of accuracy or implied warranties of merchantability or fitness for a particular purpose. Use of the data is at the user’s sole risk. In no event will Freddie Mac be liable for any damages arising out of or related to the data, including but not limited to direct, indirect, incidental, special, consequential, or punitive damages, whether under a contract, tort, or any other theory of liability, even if Freddie Mac is aware of the possibility of such damages.
Copyright, 2016, Freddie Mac. Reprinted with permission. |
 |
Federal Funds Effective Rate
| 2024-03-01 / Monthly / Percent
Averages of daily figures.
For additional historical federal funds rate data, please see Daily Federal Funds Rate from 1928-1954 (https://fred.stlouisfed.org/categories/33951).
The federal funds rate is the interest rate at which depository institutions trade federal funds (balances held at Federal Reserve Banks) with each other overnight. When a depository institution has surplus balances in its reserve account, it lends to other banks in need of larger balances. In simpler terms, a bank with excess cash, which is often referred to as liquidity, will lend to another bank that needs to quickly raise liquidity. (1) The rate that the borrowing institution pays to the lending institution is determined between the two banks; the weighted average rate for all of these types of negotiations is called the effective federal funds rate.(2) The effective federal funds rate is essentially determined by the market but is influenced by the Federal Reserve through open market operations to reach the federal funds rate target.(2)
The Federal Open Market Committee (FOMC) meets eight times a year to determine the federal funds target rate. As previously stated, this rate influences the effective federal funds rate through open market operations or by buying and selling of government bonds (government debt).(2) More specifically, the Federal Reserve decreases liquidity by selling government bonds, thereby raising the federal funds rate because banks have less liquidity to trade with other banks. Similarly, the Federal Reserve can increase liquidity by buying government bonds, decreasing the federal funds rate because banks have excess liquidity for trade. Whether the Federal Reserve wants to buy or sell bonds depends on the state of the economy. If the FOMC believes the economy is growing too fast and inflation pressures are inconsistent with the dual mandate of the Federal Reserve, the Committee may set a higher federal funds rate target to temper economic activity. In the opposing scenario, the FOMC may set a lower federal funds rate target to spur greater economic activity. Therefore, the FOMC must observe the current state of the economy to determine the best course of monetary policy that will maximize economic growth while adhering to the dual mandate set forth by Congress. In making its monetary policy decisions, the FOMC considers a wealth of economic data, such as: trends in prices and wages, employment, consumer spending and income, business investments, and foreign exchange markets.
The federal funds rate is the central interest rate in the U.S. financial market. It influences other interest rates such as the prime rate, which is the rate banks charge their customers with higher credit ratings. Additionally, the federal funds rate indirectly influences longer- term interest rates such as mortgages, loans, and savings, all of which are very important to consumer wealth and confidence.(2)
References
(1) Federal Reserve Bank of New York. "Federal funds." Fedpoints, August 2007.
(2) Board of Governors of the Federal Reserve System. "Monetary Policy (https://www.federalreserve.gov/monetarypolicy.htm)". |
 |
Overnight Reverse Repurchase Agreements: Treasury Securities Sold by the Federal Reserve in the Temporary Open Market Operations
| 2024-04-17 / Daily / Billions of US Dollars
This series is constructed as the aggregated daily amount value of the RRP transactions reported by the New York Fed as part of the Temporary Open Market Operations.
Temporary open market operations involve short-term repurchase and reverse repurchase agreements that are designed to temporarily add or drain reserves available to the banking system and influence day-to-day trading in the federal funds market.
A reverse repurchase agreement (known as reverse repo or RRP) is a transaction in which the New York Fed under the authorization and direction of the Federal Open Market Committee sells a security to an eligible counterparty with an agreement to repurchase that same security at a specified price at a specific time in the future. For these transactions, eligible securities are U.S. Treasury instruments, federal agency debt and the mortgage-backed securities issued or fully guaranteed by federal agencies.
For more information, see https://www.newyorkfed.org/markets/rrp_faq.html |
 |
10-Year Treasury Constant Maturity Minus 3-Month Treasury Constant Maturity
| 2024-04-17 / Daily / Percent
Series is calculated as the spread between 10-Year Treasury Constant Maturity (BC_10YEAR) and 3-Month Treasury Constant Maturity (BC_3MONTH).
Starting with the update on June 21, 2019, the Treasury bond data used in calculating interest rate spreads is obtained directly from the U.S. Treasury Department (https://www.treasury.gov/resource-center/data-chart-center/interest-rates/Pages/TextView.aspx?data=yield). |
 |
ICE BofA US High Yield Index Option-Adjusted Spread
| 2024-04-17 / Daily, Close / Percent
The ICE BofA Option-Adjusted Spreads (OASs) are the calculated spreads between a computed OAS index of all bonds in a given rating category and a spot Treasury curve. An OAS index is constructed using each constituent bond's OAS, weighted by market capitalization. The ICE BofA High Yield Master II OAS uses an index of bonds that are below investment grade (those rated BB or below).
This data represents the ICE BofA US High Yield Index value, which tracks the performance of US dollar denominated below investment grade rated corporate debt publicly issued in the US domestic market. To qualify for inclusion in the index, securities must have a below investment grade rating (based on an average of Moody's, S&P, and Fitch) and an investment grade rated country of risk (based on an average of Moody's, S&P, and Fitch foreign currency long term sovereign debt ratings). Each security must have greater than 1 year of remaining maturity, a fixed coupon schedule, and a minimum amount outstanding of $100 million. Original issue zero coupon bonds, "global" securities (debt issued simultaneously in the eurobond and US domestic bond markets), 144a securities and pay-in-kind securities, including toggle notes, qualify for inclusion in the Index. Callable perpetual securities qualify provided they are at least one year from the first call date. Fixed-to-floating rate securities also qualify provided they are callable within the fixed rate period and are at least one year from the last call prior to the date the bond transitions from a fixed to a floating rate security. DRD-eligible and defaulted securities are excluded from the Index.
ICE BofA Explains the Construction Methodology of this series as:
Index constituents are capitalization-weighted based on their current amount outstanding. With the exception of U.S. mortgage pass-throughs and U.S. structured products (ABS, CMBS and CMOs), accrued interest is calculated assuming next-day settlement. Accrued interest for U.S. mortgage pass-through and U.S. structured products is calculated assuming same-day settlement. Cash flows from bond payments that are received during the month are retained in the index until the end of the month and then are removed as part of the rebalancing. Cash does not earn any reinvestment income while it is held in the Index. The Index is rebalanced on the last calendar day of the month, based on information available up to and including the third business day before the last business day of the month. Issues that meet the qualifying criteria are included in the Index for the following month. Issues that no longer meet the criteria during the course of the month remain in the Index until the next month-end rebalancing at which point they are removed from the Index.
When the last calendar day of the month takes place on the weekend, weekend observations will occur as a result of month ending accrued interest adjustments.
Certain indices and index data included in FRED are the property of ICE Data Indices, LLC (“ICE DATA”) and used under license. ICE® IS A REGISTERED TRADEMARK OF ICE DATA OR ITS AFFILIATES AND BOFA® IS A REGISTERED TRADEMARK OF BANK OF AMERICA CORPORATION LICENSED BY BANK OF AMERICA CORPORATION AND ITS AFFILIATES (“BOFA”) AND MAY NOT BE USED WITHOUT BOFA’S PRIOR WRITTEN APPROVAL. ICE DATA, ITS AFFILIATES AND THEIR RESPECTIVE THIRD PARTY SUPPLIERS DISCLAIM ANY AND ALL WARRANTIES AND REPRESENTATIONS, EXPRESS AND/OR IMPLIED, INCLUDING ANY WARRANTIES OF MERCHANTABILITY OR FITNESS FOR A PARTICULAR PURPOSE OR USE, INCLUDING WITH REGARD TO THE INDICES, INDEX DATA AND ANY DATA INCLUDED IN, RELATED TO, OR DERIVED THEREFROM. NEITHER ICE DATA, NOR ITS AFFILIATES OR THEIR RESPECTIVE THIRD PARTY PROVIDERS SHALL BE SUBJECT TO ANY DAMAGES OR LIABILITY WITH RESPECT TO THE ADEQUACY, ACCURACY, TIMELINESS OR COMPLETENESS OF THE INDICES OR THE INDEX DATA OR ANY COMPONENT THEREOF. THE INDICES AND INDEX DATA AND ALL COMPONENTS THEREOF ARE PROVIDED ON AN “AS IS” BASIS AND YOUR USE IS AT YOUR OWN RISK. ICE DATA, ITS AFFILIATES AND THEIR RESPECTIVE THIRD PARTY SUPPLIERS DO NOT SPONSOR, ENDORSE, OR RECOMMEND FRED, OR ANY OF ITS PRODUCTS OR SERVICES.
Copyright, 2023, ICE Data Indices. Reproduction of this data in any form is prohibited except with the prior written permission of ICE Data Indices.
The end of day Index values, Index returns, and Index statistics (“Top Level Data”) are being provided for your internal use only and you are not authorized or permitted to publish, distribute or otherwise furnish Top Level Data to any third-party without prior written approval of ICE Data.
Neither ICE Data, its affiliates nor any of its third party suppliers shall have any liability for the accuracy or completeness of the Top Level Data furnished through FRED, or for delays, interruptions or omissions therein nor for any lost profits, direct, indirect, special or consequential damages.
The Top Level Data is not investment advice and a reference to a particular investment or security, a credit rating or any observation concerning a security or investment provided in the Top Level Data is not a recommendation to buy, sell or hold such investment or security or make any other investment decisions.
You shall not use any Indices as a reference index for the purpose of creating financial products (including but not limited to any exchange-traded fund or other passive index-tracking fund, or any other financial instrument whose objective or return is linked in any way to any Index) without prior written approval of ICE Data.
ICE Data, their affiliates or their third party suppliers have exclusive proprietary rights in the Top Level Data and any information and software received in connection therewith.
You shall not use or permit anyone to use the Top Level Data for any unlawful or unauthorized purpose.
Access to the Top Level Data is subject to termination in the event that any agreement between FRED and ICE Data terminates for any reason.
ICE Data may enforce its rights against you as the third-party beneficiary of the FRED Services Terms of Use, even though ICE Data is not a party to the FRED Services Terms of Use.
The FRED Services Terms of Use, including but limited to the limitation of liability, indemnity and disclaimer provisions, shall extend to third party suppliers. |
 |
10-Year Breakeven Inflation Rate
| 2024-04-17 / Daily / Percent
The breakeven inflation rate represents a measure of expected inflation derived from 10-Year Treasury Constant Maturity Securities (BC_10YEAR) and 10-Year Treasury Inflation-Indexed Constant Maturity Securities (TC_10YEAR). The latest value implies what market participants expect inflation to be in the next 10 years, on average.
Starting with the update on June 21, 2019, the Treasury bond data used in calculating interest rate spreads is obtained directly from the U.S. Treasury Department (https://www.treasury.gov/resource-center/data-chart-center/interest-rates/Pages/TextView.aspx?data=yield). |
 |
S&P CoreLogic Case-Shiller U.S. National Home Price Index
| 2024-01-01 / Monthly / Index Jan 2000=100
For more information regarding the index, please visit Standard & Poor's (https://www.spglobal.com/spdji/en/documents/methodologies/methodology-sp-corelogic-cs-home-price-indices.pdf). There is more information about home price sales pairs in the Methodology section. Copyright, 2016, Standard & Poor's Financial Services LLC. Reprinted with permission. |
 |
M2
| 2024-03-04 / Weekly, Ending Monday / Billions of Dollars
Before May 2020, M2 consists of M1 plus (1) savings deposits (including money market deposit accounts); (2) small-denomination time deposits (time deposits in amounts of less than $100,000) less individual retirement account (IRA) and Keogh balances at depository institutions; and (3) balances in retail money market funds (MMFs) less IRA and Keogh balances at MMFs.
Beginning May 2020, M2 consists of M1 plus (1) small-denomination time deposits (time deposits in amounts of less than $100,000) less IRA and Keogh balances at depository institutions; and (2) balances in retail MMFs less IRA and Keogh balances at MMFs. Seasonally adjusted M2 is constructed by summing savings deposits (before May 2020), small-denomination time deposits, and retail MMFs, each seasonally adjusted separately, and adding this result to seasonally adjusted M1.
For more information on the H.6 release changes and the regulatory amendment that led to the creation of the other liquid deposits component and its inclusion in the M1 monetary aggregate, see the H.6 announcements (https://www.federalreserve.gov/feeds/h6.html) and Technical Q&As (https://www.federalreserve.gov/releases/h6/h6_technical_qa.htm) posted on December 17, 2020. |
 |
Federal Funds Effective Rate
| 2024-04-16 / Daily, 7-Day / Percent
For additional historical federal funds rate data, please see Daily Federal Funds Rate from 1928-1954 (https://fred.stlouisfed.org/categories/33951).
The federal funds rate is the interest rate at which depository institutions trade federal funds (balances held at Federal Reserve Banks) with each other overnight. When a depository institution has surplus balances in its reserve account, it lends to other banks in need of larger balances. In simpler terms, a bank with excess cash, which is often referred to as liquidity, will lend to another bank that needs to quickly raise liquidity. (1) The rate that the borrowing institution pays to the lending institution is determined between the two banks; the weighted average rate for all of these types of negotiations is called the effective federal funds rate.(2) The effective federal funds rate is essentially determined by the market but is influenced by the Federal Reserve through open market operations to reach the federal funds rate target.(2)
The Federal Open Market Committee (FOMC) meets eight times a year to determine the federal funds target rate. As previously stated, this rate influences the effective federal funds rate through open market operations or by buying and selling of government bonds (government debt).(2) More specifically, the Federal Reserve decreases liquidity by selling government bonds, thereby raising the federal funds rate because banks have less liquidity to trade with other banks. Similarly, the Federal Reserve can increase liquidity by buying government bonds, decreasing the federal funds rate because banks have excess liquidity for trade. Whether the Federal Reserve wants to buy or sell bonds depends on the state of the economy. If the FOMC believes the economy is growing too fast and inflation pressures are inconsistent with the dual mandate of the Federal Reserve, the Committee may set a higher federal funds rate target to temper economic activity. In the opposing scenario, the FOMC may set a lower federal funds rate target to spur greater economic activity. Therefore, the FOMC must observe the current state of the economy to determine the best course of monetary policy that will maximize economic growth while adhering to the dual mandate set forth by Congress. In making its monetary policy decisions, the FOMC considers a wealth of economic data, such as: trends in prices and wages, employment, consumer spending and income, business investments, and foreign exchange markets.
The federal funds rate is the central interest rate in the U.S. financial market. It influences other interest rates such as the prime rate, which is the rate banks charge their customers with higher credit ratings. Additionally, the federal funds rate indirectly influences longer- term interest rates such as mortgages, loans, and savings, all of which are very important to consumer wealth and confidence.(2)
References
(1) Federal Reserve Bank of New York. "Federal funds." Fedpoints, August 2007.
(2) Monetary Policy (https://www.federalreserve.gov/monetarypolicy.htm), Board of Governors of the Federal Reserve System. |
 |
Inflation, consumer prices for the United States
| 2022-01-01 / Annual / Percent
Inflation as measured by the consumer price index reflects the annual percentage change in the cost to the average consumer of acquiring a basket of goods and services that may be fixed or changed at specified intervals, such as yearly. The Laspeyres formula is generally used.
International Monetary Fund, International Financial Statistics and data files. |
 |
S&P 500
| 2024-04-17 / Daily, Close / Index
The observations for the S&P 500 represent the daily index value at market close. The market typically closes at 4 PM ET, except for holidays when it sometimes closes early.
The Federal Reserve Bank of St. Louis and S&P Dow Jones Indices LLC have reached a new agreement on the use of Standard & Poors and Dow Jones Averages series in FRED. FRED and its associated services will include 10 years of daily history for Standard & Poors and Dow Jones Averages series.
The S&P 500 is regarded as a gauge of the large cap U.S. equities market. The index includes 500 leading companies in leading industries of the U.S. economy, which are publicly held on either the NYSE or NASDAQ, and covers 75% of U.S. equities. Since this is a price index and not a total return index, the S&P 500 index here does not contain dividends.
Copyright © 2016, S&P Dow Jones Indices LLC. All rights reserved. Reproduction of S&P 500 in any form is prohibited except with the prior written permission of S&P Dow Jones Indices LLC ("S&P"). S&P does not guarantee the accuracy, adequacy, completeness or availability of any information and is not responsible for any errors or omissions, regardless of the cause or for the results obtained from the use of such information. S&P DISCLAIMS ANY AND ALL EXPRESS OR IMPLIED WARRANTIES, INCLUDING, BUT NOT LIMITED TO, ANY WARRANTIES OF MERCHANTABILITY OR FITNESS FOR A PARTICULAR PURPOSE OR USE. In no event shall S&P be liable for any direct, indirect, special or consequential damages, costs, expenses, legal fees, or losses (including lost income or lost profit and opportunity costs) in connection with subscriber's or others' use of S&P 500.
Permission to reproduce S&P 500 can be requested from [email protected]. More contact details are available here (http://us.spindices.com/contact-us), including phone numbers for all regional offices. |
 |
5-Year Breakeven Inflation Rate
| 2024-04-17 / Daily / Percent
The breakeven inflation rate represents a measure of expected inflation derived from 5-Year Treasury Constant Maturity Securities (BC_5YEAR) and 5-Year Treasury Inflation-Indexed Constant Maturity Securities (TC_5YEAR). The latest value implies what market participants expect inflation to be in the next 5 years, on average.
Starting with the update on June 21, 2019, the Treasury bond data used in calculating interest rate spreads is obtained directly from the U.S. Treasury Department (https://www.treasury.gov/resource-center/data-chart-center/interest-rates/Pages/TextView.aspx?data=yield). |
 |
Real Median Household Income in the United States
| 2022-01-01 / Annual / 2022 CPI-U-RS Adjusted Dollars
Household data are collected as of March.
As stated in the Census's Source and Accuracy of Estimates for Income, Poverty, and Health Insurance Coverage in the United States: 2011 (http://www.census.gov/hhes/www/p60_243sa.pdf).
Estimation of Median Incomes. The Census Bureau has changed the methodology for computing median income over time. The Census Bureau has computed medians using either Pareto interpolation or linear interpolation. Currently, we are using linear interpolation to estimate all medians. Pareto interpolation assumes a decreasing density of population within an income interval, whereas linear interpolation assumes a constant density of population within an income interval. The Census Bureau calculated estimates of median income and associated standard errors for 1979 through 1987 using Pareto interpolation if the estimate was larger than $20,000 for people or $40,000 for families and households. This is because the width of the income interval containing the estimate is greater than $2,500.
We calculated estimates of median income and associated standard errors for 1976, 1977, and 1978 using Pareto interpolation if the estimate was larger than $12,000 for people or $18,000 for families and households. This is because the width of the income interval containing the estimate is greater than $1,000. All other estimates of median income and associated standard errors for 1976 through 2011 (2012 ASEC) and almost all of the estimates of median income and associated standard errors for 1975 and earlier were calculated using linear interpolation.
Thus, use caution when comparing median incomes above $12,000 for people or $18,000 for families and households for different years. Median incomes below those levels are more comparable from year to year since they have always been calculated using linear interpolation. For an indication of the comparability of medians calculated using Pareto interpolation with medians calculated using linear interpolation, see Series P-60, Number 114, (https://www2.census.gov/prod2/popscan/p60-114.pdf) Money Income in 1976 of Families and Persons in the United States. |
 |
ICE BofA US High Yield Index Effective Yield
| 2024-04-17 / Daily, Close / Percent
This data represents the effective yield of the ICE BofA US High Yield Index, which tracks the performance of US dollar denominated below investment grade rated corporate debt publicly issued in the US domestic market. To qualify for inclusion in the index, securities must have a below investment grade rating (based on an average of Moody's, S&P, and Fitch) and an investment grade rated country of risk (based on an average of Moody's, S&P, and Fitch foreign currency long term sovereign debt ratings). Each security must have greater than 1 year of remaining maturity, a fixed coupon schedule, and a minimum amount outstanding of $100 million. Original issue zero coupon bonds, "global" securities (debt issued simultaneously in the eurobond and US domestic bond markets), 144a securities and pay-in-kind securities, including toggle notes, qualify for inclusion in the Index. Callable perpetual securities qualify provided they are at least one year from the first call date. Fixed-to-floating rate securities also qualify provided they are callable within the fixed rate period and are at least one year from the last call prior to the date the bond transitions from a fixed to a floating rate security. DRD-eligible and defaulted securities are excluded from the Index.
ICE BofA Explains the Construction Methodology of this series as:
Index constituents are capitalization-weighted based on their current amount outstanding. With the exception of U.S. mortgage pass-throughs and U.S. structured products (ABS, CMBS and CMOs), accrued interest is calculated assuming next-day settlement. Accrued interest for U.S. mortgage pass-through and U.S. structured products is calculated assuming same-day settlement. Cash flows from bond payments that are received during the month are retained in the index until the end of the month and then are removed as part of the rebalancing. Cash does not earn any reinvestment income while it is held in the Index. The Index is rebalanced on the last calendar day of the month, based on information available up to and including the third business day before the last business day of the month. Issues that meet the qualifying criteria are included in the Index for the following month. Issues that no longer meet the criteria during the course of the month remain in the Index until the next month-end rebalancing at which point they are removed from the Index.
When the last calendar day of the month takes place on the weekend, weekend observations will occur as a result of month ending accrued interest adjustments.
Certain indices and index data included in FRED are the property of ICE Data Indices, LLC (“ICE DATA”) and used under license. ICE® IS A REGISTERED TRADEMARK OF ICE DATA OR ITS AFFILIATES AND BOFA® IS A REGISTERED TRADEMARK OF BANK OF AMERICA CORPORATION LICENSED BY BANK OF AMERICA CORPORATION AND ITS AFFILIATES (“BOFA”) AND MAY NOT BE USED WITHOUT BOFA’S PRIOR WRITTEN APPROVAL. ICE DATA, ITS AFFILIATES AND THEIR RESPECTIVE THIRD PARTY SUPPLIERS DISCLAIM ANY AND ALL WARRANTIES AND REPRESENTATIONS, EXPRESS AND/OR IMPLIED, INCLUDING ANY WARRANTIES OF MERCHANTABILITY OR FITNESS FOR A PARTICULAR PURPOSE OR USE, INCLUDING WITH REGARD TO THE INDICES, INDEX DATA AND ANY DATA INCLUDED IN, RELATED TO, OR DERIVED THEREFROM. NEITHER ICE DATA, NOR ITS AFFILIATES OR THEIR RESPECTIVE THIRD PARTY PROVIDERS SHALL BE SUBJECT TO ANY DAMAGES OR LIABILITY WITH RESPECT TO THE ADEQUACY, ACCURACY, TIMELINESS OR COMPLETENESS OF THE INDICES OR THE INDEX DATA OR ANY COMPONENT THEREOF. THE INDICES AND INDEX DATA AND ALL COMPONENTS THEREOF ARE PROVIDED ON AN “AS IS” BASIS AND YOUR USE IS AT YOUR OWN RISK. ICE DATA, ITS AFFILIATES AND THEIR RESPECTIVE THIRD PARTY SUPPLIERS DO NOT SPONSOR, ENDORSE, OR RECOMMEND FRED, OR ANY OF ITS PRODUCTS OR SERVICES.
Copyright, 2023, ICE Data Indices. Reproduction of this data in any form is prohibited except with the prior written permission of ICE Data Indices.
The end of day Index values, Index returns, and Index statistics (“Top Level Data”) are being provided for your internal use only and you are not authorized or permitted to publish, distribute or otherwise furnish Top Level Data to any third-party without prior written approval of ICE Data.
Neither ICE Data, its affiliates nor any of its third party suppliers shall have any liability for the accuracy or completeness of the Top Level Data furnished through FRED, or for delays, interruptions or omissions therein nor for any lost profits, direct, indirect, special or consequential damages.
The Top Level Data is not investment advice and a reference to a particular investment or security, a credit rating or any observation concerning a security or investment provided in the Top Level Data is not a recommendation to buy, sell or hold such investment or security or make any other investment decisions.
You shall not use any Indices as a reference index for the purpose of creating financial products (including but not limited to any exchange-traded fund or other passive index-tracking fund, or any other financial instrument whose objective or return is linked in any way to any Index) without prior written approval of ICE Data.
ICE Data, their affiliates or their third party suppliers have exclusive proprietary rights in the Top Level Data and any information and software received in connection therewith.
You shall not use or permit anyone to use the Top Level Data for any unlawful or unauthorized purpose.
Access to the Top Level Data is subject to termination in the event that any agreement between FRED and ICE Data terminates for any reason.
ICE Data may enforce its rights against you as the third-party beneficiary of the FRED Services Terms of Use, even though ICE Data is not a party to the FRED Services Terms of Use.
The FRED Services Terms of Use, including but limited to the limitation of liability, indemnity and disclaimer provisions, shall extend to third party suppliers. |
 |
5-Year, 5-Year Forward Inflation Expectation Rate
| 2024-04-17 / Daily / Percent
This series is a measure of expected inflation (on average) over the five-year period that begins five years from today.
This series is constructed as:
(((((1+((BC_10YEAR-TC_10YEAR)/100))^10)/((1+((BC_5YEAR-TC_5YEAR)/100))^5))^0.2)-1)*100
where BC10_YEAR, TC_10YEAR, BC_5YEAR, and TC_5YEAR are the 10 year and 5 year nominal and inflation adjusted Treasury securities.
Starting with the update on June 21, 2019, the Treasury bond data used in calculating interest rate spreads is obtained directly from the U.S. Treasury Department (https://www.treasury.gov/resource-center/data-chart-center/interest-rates/Pages/TextView.aspx?data=yield). |
 |
10-Year Real Interest Rate
| 2024-04-01 / Monthly / Percent
The Federal Reserve Bank of Cleveland estimates the expected rate of inflation over the next 30 years along with the inflation risk premium, the real risk premium, and the real interest rate.
Their estimates are calculated with a model that uses Treasury yields, inflation data, inflation swaps, and survey-based measures of inflation expectations.
For more information, please visit the <a href="https://www.clevelandfed.org/indicators-and-data/inflation-expectations#background">Federal Reserve Bank of Cleveland<a/>. |
 |
Moody's Seasoned Aaa Corporate Bond Yield
| 2024-03-01 / Monthly / Percent
These instruments are based on bonds with maturities 20 years and above.
© 2017, Moody’s Corporation, Moody’s Investors Service, Inc., Moody’s Analytics, Inc. and/or their licensors and affiliates (collectively, “Moody’s”). All rights reserved. Moody’s ratings and other information (“Moody’s Information”) are proprietary to Moody’s and/or its licensors and are protected by copyright and other intellectual property laws. Moody’s Information is licensed to Client by Moody’s. MOODY’S INFORMATION MAY NOT BE COPIED OR OTHERWISE REPRODUCED, REPACKAGED, FURTHER TRANSMITTED, TRANSFERRED, DISSEMINATED, REDISTRIBUTED OR RESOLD, OR STORED FOR SUBSEQUENT USE FOR ANY SUCH PURPOSE, IN WHOLE OR IN PART, IN ANY FORM OR MANNER OR BY ANY MEANS WHATSOEVER, BY ANY PERSON WITHOUT MOODY’S PRIOR WRITTEN CONSENT. |
 |
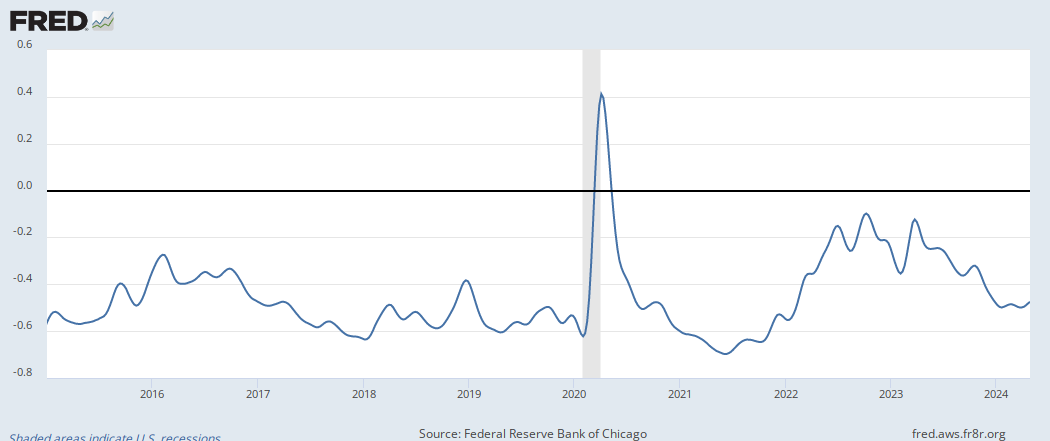
Chicago Fed National Financial Conditions Index
| 2024-04-12 / Weekly, Ending Friday / Index
The Chicago Fed's National Financial Conditions Index (NFCI) provides a comprehensive weekly update on U.S. financial conditions in money markets, debt and equity markets and the traditional and "shadow" banking systems. Positive values of the NFCI indicate financial conditions that are tighter than average, while negative values indicate financial conditions that are looser than average.
For further information, please visit the Federal Reserve Bank of Chicago (http://www.chicagofed.org/webpages/publications/nfci/index.cfm). |
 |
University of Michigan: Consumer Sentiment
| 2024-02-01 / Monthly / Index 1966:Q1=100
At the request of the source, the data is delayed by 1 month. To obtain historical data prior to January 1978, please see FRED data series UMCSENT1.
This data should be cited as follows: "Surveys of Consumers, University of Michigan, University of Michigan: Consumer Sentiment © [UMCSENT], retrieved from FRED, Federal Reserve Bank of St. Louis (https://fred.stlouisfed.org/series/UMCSENT/), (Accessed on date)"
Copyright, 2016, Surveys of Consumers, University of Michigan. Reprinted with permission. |
 |
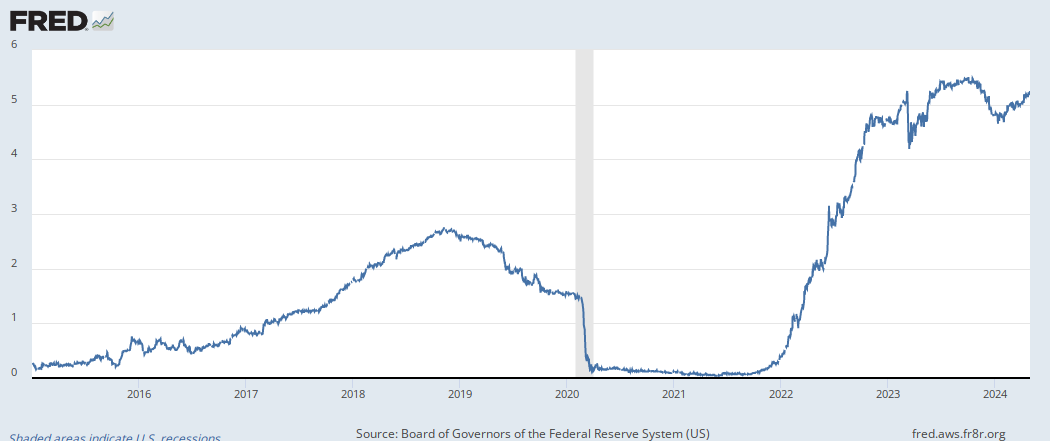
Federal Funds Target Range - Upper Limit
| 2024-04-18 / Daily, 7-Day / Percent
This series represents upper limit of the federal funds target range established by the Federal Open Market Committee. The data updated each day is the data effective as of that day. |
 |
ICE BofA BBB US Corporate Index Option-Adjusted Spread
| 2024-04-17 / Daily, Close / Percent
This data represents the Option-Adjusted Spread (OAS) of the ICE BofA BBB US Corporate Index, a subset of the ICE BofA US Corporate Master Index tracking the performance of US dollar denominated investment grade rated corporate debt publicly issued in the US domestic market. This subset includes all securities with a given investment grade rating BBB.
The ICE BofA OASs are the calculated spreads between a computed OAS index of all bonds in a given rating category and a spot Treasury curve. An OAS index is constructed using each constituent bond's OAS, weighted by market capitalization. When the last calendar day of the month takes place on the weekend, weekend observations will occur as a result of month ending accrued interest adjustments.
Certain indices and index data included in FRED are the property of ICE Data Indices, LLC (“ICE DATA”) and used under license. ICE® IS A REGISTERED TRADEMARK OF ICE DATA OR ITS AFFILIATES AND BOFA® IS A REGISTERED TRADEMARK OF BANK OF AMERICA CORPORATION LICENSED BY BANK OF AMERICA CORPORATION AND ITS AFFILIATES (“BOFA”) AND MAY NOT BE USED WITHOUT BOFA’S PRIOR WRITTEN APPROVAL. ICE DATA, ITS AFFILIATES AND THEIR RESPECTIVE THIRD PARTY SUPPLIERS DISCLAIM ANY AND ALL WARRANTIES AND REPRESENTATIONS, EXPRESS AND/OR IMPLIED, INCLUDING ANY WARRANTIES OF MERCHANTABILITY OR FITNESS FOR A PARTICULAR PURPOSE OR USE, INCLUDING WITH REGARD TO THE INDICES, INDEX DATA AND ANY DATA INCLUDED IN, RELATED TO, OR DERIVED THEREFROM. NEITHER ICE DATA, NOR ITS AFFILIATES OR THEIR RESPECTIVE THIRD PARTY PROVIDERS SHALL BE SUBJECT TO ANY DAMAGES OR LIABILITY WITH RESPECT TO THE ADEQUACY, ACCURACY, TIMELINESS OR COMPLETENESS OF THE INDICES OR THE INDEX DATA OR ANY COMPONENT THEREOF. THE INDICES AND INDEX DATA AND ALL COMPONENTS THEREOF ARE PROVIDED ON AN “AS IS” BASIS AND YOUR USE IS AT YOUR OWN RISK. ICE DATA, ITS AFFILIATES AND THEIR RESPECTIVE THIRD PARTY SUPPLIERS DO NOT SPONSOR, ENDORSE, OR RECOMMEND FRED, OR ANY OF ITS PRODUCTS OR SERVICES.
Copyright, 2023, ICE Data Indices. Reproduction of this data in any form is prohibited except with the prior written permission of ICE Data Indices.
The end of day Index values, Index returns, and Index statistics (“Top Level Data”) are being provided for your internal use only and you are not authorized or permitted to publish, distribute or otherwise furnish Top Level Data to any third-party without prior written approval of ICE Data.
Neither ICE Data, its affiliates nor any of its third party suppliers shall have any liability for the accuracy or completeness of the Top Level Data furnished through FRED, or for delays, interruptions or omissions therein nor for any lost profits, direct, indirect, special or consequential damages.
The Top Level Data is not investment advice and a reference to a particular investment or security, a credit rating or any observation concerning a security or investment provided in the Top Level Data is not a recommendation to buy, sell or hold such investment or security or make any other investment decisions.
You shall not use any Indices as a reference index for the purpose of creating financial products (including but not limited to any exchange-traded fund or other passive index-tracking fund, or any other financial instrument whose objective or return is linked in any way to any Index) without prior written approval of ICE Data.
ICE Data, their affiliates or their third party suppliers have exclusive proprietary rights in the Top Level Data and any information and software received in connection therewith.
You shall not use or permit anyone to use the Top Level Data for any unlawful or unauthorized purpose.
Access to the Top Level Data is subject to termination in the event that any agreement between FRED and ICE Data terminates for any reason.
ICE Data may enforce its rights against you as the third-party beneficiary of the FRED Services Terms of Use, even though ICE Data is not a party to the FRED Services Terms of Use.
The FRED Services Terms of Use, including but limited to the limitation of liability, indemnity and disclaimer provisions, shall extend to third party suppliers. |
 |
Federal Surplus or Deficit [-]
| 2023-09-30 / Annual, Fiscal Year / Millions of Dollars
Dates represent the end of the fiscal year. Fiscal year series are updated with official OMB figures in January or February. In October, the latest fiscal year is updated with figures from the Treasury Department (September figures from the Treasury's fiscal year to date series). |
 |
Housing Inventory: Active Listing Count in the United States
| 2024-03-01 / Monthly / Level
The count of active single-family and condo/townhome listings for a given market during the specified month (excludes pending listings).
With the release of its September 2022 housing trends report, Realtor.com® incorporated a new and improved methodology for capturing and reporting housing inventory trends and metrics. The new methodology updates and improves the calculation of time on market and improves handling of duplicate listings. Most areas across the country will see minor changes with a smaller handful of areas seeing larger updates. As a result of these changes, the data released since October 2022 will not be directly comparable with previous data releases (files downloaded before October 2022) and Realtor.com® economics blog posts. However, future data releases, including historical data, will consistently apply the new methodology. More details are available at the source's Real Estate Data Library (https://www.realtor.com/research/data/).
With the release of its November 2021 housing trends report, Realtor.com® incorporated a new and improved methodology for capturing and reporting housing inventory trends and metrics. The new methodology uses the latest and most accurate data mapping of listing statuses to yield a cleaner and more consistent measurement of active listings at both the national and local level. The methodology has also been adjusted to better account for missing data in some fields including square footage. Most areas across the country will see minor changes with a smaller handful of areas seeing larger updates. As a result of these changes, the data released since December 2021 will not be directly comparable with previous data releases (files downloaded before December 2021) and Realtor.com® economics blog posts. However, future data releases, including historical data, will consistently apply the new methodology. More details are available at the source's Real Estate Data Library (https://www.realtor.com/research/data/). |
 |
Monetary Base; Total
| 2024-02-01 / Monthly / Millions of Dollars
The Board of Governors consolidated this series onto the Statistical Release H.6, "Money Stock Measures", after the H.3 statistical release was discontinued. For more information on the consolidated H.6 release, see the H.6 Technical Q&As (https://www.federalreserve.gov/releases/h6/h6_technical_qa.htm).
The series equals total balances maintained plus currency in circulation. |
 |
ICE BofA US Corporate Index Option-Adjusted Spread
| 2024-04-17 / Daily, Close / Percent
The ICE BofA Option-Adjusted Spreads (OASs) are the calculated spreads between a computed OAS index of all bonds in a given rating category and a spot Treasury curve. An OAS index is constructed using each constituent bond's OAS, weighted by market capitalization. The Corporate Master OAS uses an index of bonds that are considered investment grade (those rated BBB or better). When the last calendar day of the month takes place on the weekend, weekend observations will occur as a result of month ending accrued interest adjustments.
This data represents the ICE BofA US Corporate Index value, which tracks the performance of US dollar denominated investment grade rated corporate debt publicly issued in the US domestic market. To qualify for inclusion in the index, securities must have an investment grade rating (based on an average of Moody's, S&P, and Fitch) and an investment grade rated country of risk (based on an average of Moody's, S&P, and Fitch foreign currency long term sovereign debt ratings). Each security must have greater than 1 year of remaining maturity, a fixed coupon schedule, and a minimum amount outstanding of $250 million. Original issue zero coupon bonds, "global" securities (debt issued simultaneously in the eurobond and US
domestic bond markets), 144a securities and pay-in-kind securities, including toggle notes, qualify for inclusion in the Index. Callable perpetual securities qualify provided they are at least one year from the first call date. Fixed-to-floating rate securities also qualify provided they are callable within the fixed rate period and are at least one year from the last call prior to the date the bond transitions from a fixed to a floating rate security. DRD-eligible and defaulted securities are excluded from the Index.
ICE BofA Explains the Construction Methodology of this series as:
Index constituents are capitalization-weighted based on their current amount outstanding. With the exception of U.S. mortgage pass-throughs and U.S. structured products (ABS, CMBS and CMOs), accrued interest is calculated assuming next-day settlement. Accrued interest for U.S. mortgage pass-through and U.S. structured products is calculated assuming same-day settlement. Cash flows from bond payments that are received during the month are retained in the index until the end of the month and then are removed as part of the rebalancing. Cash does not earn any reinvestment income while it is held in the Index. The Index is rebalanced on the last calendar day of the month, based on information available up to and including the third business day before the last business day of the month. Issues that meet the qualifying criteria are included in the Index for the following month. Issues that no longer meet the criteria during the course of the month
remain in the Index until the next month-end rebalancing at which point they are removed from the Index.
When the last calendar day of the month takes place on the weekend, weekend observations will occur as a result of month ending accrued interest adjustments.
Certain indices and index data included in FRED are the property of ICE Data Indices, LLC (“ICE DATA”) and used under license. ICE® IS A REGISTERED TRADEMARK OF ICE DATA OR ITS AFFILIATES AND BOFA® IS A REGISTERED TRADEMARK OF BANK OF AMERICA CORPORATION LICENSED BY BANK OF AMERICA CORPORATION AND ITS AFFILIATES (“BOFA”) AND MAY NOT BE USED WITHOUT BOFA’S PRIOR WRITTEN APPROVAL. ICE DATA, ITS AFFILIATES AND THEIR RESPECTIVE THIRD PARTY SUPPLIERS DISCLAIM ANY AND ALL WARRANTIES AND REPRESENTATIONS, EXPRESS AND/OR IMPLIED, INCLUDING ANY WARRANTIES OF MERCHANTABILITY OR FITNESS FOR A PARTICULAR PURPOSE OR USE, INCLUDING WITH REGARD TO THE INDICES, INDEX DATA AND ANY DATA INCLUDED IN, RELATED TO, OR DERIVED THEREFROM. NEITHER ICE DATA, NOR ITS AFFILIATES OR THEIR RESPECTIVE THIRD PARTY PROVIDERS SHALL BE SUBJECT TO ANY DAMAGES OR LIABILITY WITH RESPECT TO THE ADEQUACY, ACCURACY, TIMELINESS OR COMPLETENESS OF THE INDICES OR THE INDEX DATA OR ANY COMPONENT THEREOF. THE INDICES AND INDEX DATA AND ALL COMPONENTS THEREOF ARE PROVIDED ON AN “AS IS” BASIS AND YOUR USE IS AT YOUR OWN RISK. ICE DATA, ITS AFFILIATES AND THEIR RESPECTIVE THIRD PARTY SUPPLIERS DO NOT SPONSOR, ENDORSE, OR RECOMMEND FRED, OR ANY OF ITS PRODUCTS OR SERVICES.
Copyright, 2023, ICE Data Indices. Reproduction of this data in any form is prohibited except with the prior written permission of ICE Data Indices.
The end of day Index values, Index returns, and Index statistics (“Top Level Data”) are being provided for your internal use only and you are not authorized or permitted to publish, distribute or otherwise furnish Top Level Data to any third-party without prior written approval of ICE Data.
Neither ICE Data, its affiliates nor any of its third party suppliers shall have any liability for the accuracy or completeness of the Top Level Data furnished through FRED, or for delays, interruptions or omissions therein nor for any lost profits, direct, indirect, special or consequential damages.
The Top Level Data is not investment advice and a reference to a particular investment or security, a credit rating or any observation concerning a security or investment provided in the Top Level Data is not a recommendation to buy, sell or hold such investment or security or make any other investment decisions.
You shall not use any Indices as a reference index for the purpose of creating financial products (including but not limited to any exchange-traded fund or other passive index-tracking fund, or any other financial instrument whose objective or return is linked in any way to any Index) without prior written approval of ICE Data.
ICE Data, their affiliates or their third party suppliers have exclusive proprietary rights in the Top Level Data and any information and software received in connection therewith.
You shall not use or permit anyone to use the Top Level Data for any unlawful or unauthorized purpose.
Access to the Top Level Data is subject to termination in the event that any agreement between FRED and ICE Data terminates for any reason.
ICE Data may enforce its rights against you as the third-party beneficiary of the FRED Services Terms of Use, even though ICE Data is not a party to the FRED Services Terms of Use.
The FRED Services Terms of Use, including but limited to the limitation of liability, indemnity and disclaimer provisions, shall extend to third party suppliers. |
 |
ICE BofA BBB US Corporate Index Effective Yield
| 2024-04-17 / Daily, Close / Percent
This data represents the effective yield of the ICE BofA BBB US Corporate Index, a subset of the ICE BofA US Corporate Master Index tracking the performance of US dollar denominated investment grade rated corporate debt publicly issued in the US domestic market. This subset includes all securities with a given investment grade rating BBB. When the last calendar day of the month takes place on the weekend, weekend observations will occur as a result of month ending accrued interest adjustments.
Certain indices and index data included in FRED are the property of ICE Data Indices, LLC (“ICE DATA”) and used under license. ICE® IS A REGISTERED TRADEMARK OF ICE DATA OR ITS AFFILIATES AND BOFA® IS A REGISTERED TRADEMARK OF BANK OF AMERICA CORPORATION LICENSED BY BANK OF AMERICA CORPORATION AND ITS AFFILIATES (“BOFA”) AND MAY NOT BE USED WITHOUT BOFA’S PRIOR WRITTEN APPROVAL. ICE DATA, ITS AFFILIATES AND THEIR RESPECTIVE THIRD PARTY SUPPLIERS DISCLAIM ANY AND ALL WARRANTIES AND REPRESENTATIONS, EXPRESS AND/OR IMPLIED, INCLUDING ANY WARRANTIES OF MERCHANTABILITY OR FITNESS FOR A PARTICULAR PURPOSE OR USE, INCLUDING WITH REGARD TO THE INDICES, INDEX DATA AND ANY DATA INCLUDED IN, RELATED TO, OR DERIVED THEREFROM. NEITHER ICE DATA, NOR ITS AFFILIATES OR THEIR RESPECTIVE THIRD PARTY PROVIDERS SHALL BE SUBJECT TO ANY DAMAGES OR LIABILITY WITH RESPECT TO THE ADEQUACY, ACCURACY, TIMELINESS OR COMPLETENESS OF THE INDICES OR THE INDEX DATA OR ANY COMPONENT THEREOF. THE INDICES AND INDEX DATA AND ALL COMPONENTS THEREOF ARE PROVIDED ON AN “AS IS” BASIS AND YOUR USE IS AT YOUR OWN RISK. ICE DATA, ITS AFFILIATES AND THEIR RESPECTIVE THIRD PARTY SUPPLIERS DO NOT SPONSOR, ENDORSE, OR RECOMMEND FRED, OR ANY OF ITS PRODUCTS OR SERVICES.
Copyright, 2023, ICE Data Indices. Reproduction of this data in any form is prohibited except with the prior written permission of ICE Data Indices.
The end of day Index values, Index returns, and Index statistics (“Top Level Data”) are being provided for your internal use only and you are not authorized or permitted to publish, distribute or otherwise furnish Top Level Data to any third-party without prior written approval of ICE Data.
Neither ICE Data, its affiliates nor any of its third party suppliers shall have any liability for the accuracy or completeness of the Top Level Data furnished through FRED, or for delays, interruptions or omissions therein nor for any lost profits, direct, indirect, special or consequential damages.
The Top Level Data is not investment advice and a reference to a particular investment or security, a credit rating or any observation concerning a security or investment provided in the Top Level Data is not a recommendation to buy, sell or hold such investment or security or make any other investment decisions.
You shall not use any Indices as a reference index for the purpose of creating financial products (including but not limited to any exchange-traded fund or other passive index-tracking fund, or any other financial instrument whose objective or return is linked in any way to any Index) without prior written approval of ICE Data.
ICE Data, their affiliates or their third party suppliers have exclusive proprietary rights in the Top Level Data and any information and software received in connection therewith.
You shall not use or permit anyone to use the Top Level Data for any unlawful or unauthorized purpose.
Access to the Top Level Data is subject to termination in the event that any agreement between FRED and ICE Data terminates for any reason.
ICE Data may enforce its rights against you as the third-party beneficiary of the FRED Services Terms of Use, even though ICE Data is not a party to the FRED Services Terms of Use.
The FRED Services Terms of Use, including but limited to the limitation of liability, indemnity and disclaimer provisions, shall extend to third party suppliers. |
 |
Effective Federal Funds Rate
| 2024-04-17 / Daily / Percent
For additional historical federal funds rate data, please see Daily Federal Funds Rate from 1928-1954 (https://fred.stlouisfed.org/categories/33951).
The federal funds market consists of domestic unsecured borrowings in U.S. dollars by depository institutions from other depository institutions and certain other entities, primarily government-sponsored enterprises.
The effective federal funds rate (EFFR) is calculated as a volume-weighted median of overnight federal funds transactions reported in the FR 2420 Report of Selected Money Market Rates.
For more information, visit the Federal Reserve Bank of New York (https://www.newyorkfed.org/markets/obfrinfo). |
 |
Liabilities and Capital: Other Factors Draining Reserve Balances: Reserve Balances with Federal Reserve Banks: Week Average
| 2024-04-10 / Weekly, Ending Wednesday / Billions of U.S. Dollars
Feb 1984 - Dec 1990: Annual Statistical Digest, various issues, Table 2.
Jan 1991 to date: Federal Reserve Board, H.4.1.
Reserve balances with Federal Reserve Banks are the difference between "total factors supplying reserve funds" and "total factors, other than reserve balances, absorbing reserve funds." This item includes balances at the Federal Reserve of all depository institutions that are used to satisfy reserve requirements and balances held in excess of balance requirements. It excludes reserves held in the form of cash in bank vaults, and excludes service-related deposits |
 |
Average Price: Eggs, Grade A, Large (Cost per Dozen) in U.S. City Average
| 2024-03-01 / Monthly / U.S. Dollars
Large white, Grade A chicken eggs, sold in a carton of a dozen. Includes organic, non-organic, cage free, free range, and traditional.
Average consumer prices are calculated for household fuel, motor fuel, and food items from prices collected for the Consumer Price Index (CPI). Average prices are best used to measure the price level in a particular month, not to measure price change over time. It is more appropriate to use CPI index values for the particular item categories to measure price change.
Prices, except for electricity, are collected monthly by BLS representatives in the 75 urban areas priced for the CPI. Electricity prices are collected for the BLS for the same 75 areas on a monthly basis by the Department of Energy using mail questionnaires. All fuel prices include applicable Federal, State, and local taxes; prices for natural gas and electricity also include fuel and purchased gas adjustments.
For more information, please visit the Bureau of Labor Statistics (https://www.bls.gov/cpi/factsheets/average-prices.htm). |
 |
Market Yield on U.S. Treasury Securities at 30-Year Constant Maturity, Quoted on an Investment Basis
| 2024-04-16 / Daily / Percent
Yields on actively traded non-inflation-indexed issues adjusted to constant maturities. The 30-year Treasury constant maturity series was discontinued on February 18, 2002, and reintroduced on February 9, 2006.
For further information regarding treasury constant maturity data, please refer to the H.15 Statistical Release notes (https://www.federalreserve.gov/releases/h15/default.htm) and the Treasury Yield Curve Methodology (https://home.treasury.gov/policy-issues/financing-the-government/interest-rate-statistics/treasury-yield-curve-methodology). |
 |
Money Market Funds; Total Financial Assets, Level
| 2023-10-01 / Quarterly / Millions of Dollars
Source ID: FL634090005.Q
For more information about the Flow of Funds tables, see the Financial Accounts Guide (https://www.federalreserve.gov/apps/fof/Default.aspx).
With each quarterly release, the source may make major data and structural revisions to the series and tables. These changes are available in the Release Highlights (https://www.federalreserve.gov/apps/fof/FOFHighlight.aspx).
In the Financial Accounts, the source identifies each series by a string of patterned letters and numbers. For a detailed description, including how this series is constructed, see the series analyzer (https://www.federalreserve.gov/apps/fof/SeriesAnalyzer.aspx?s=FL634090005&t=) provided by the source. |
 |
15-Year Fixed Rate Mortgage Average in the United States
| 2024-04-18 / Weekly, Ending Thursday / Percent
On November 17, 2022, Freddie Mac changed the methodology of the Primary Mortgage Market Survey® (PMMS®). The weekly mortgage rate is now based on applications submitted to Freddie Mac from lenders across the country. For more information regarding Freddie Mac’s enhancement, see their research note (https://www.freddiemac.com/research/insight/20221103-freddie-macs-newly-enhanced-mortgage-rate-survey).
Data are provided “as is” by Freddie Mac®, with no warranties of any kind, express or implied, including but not limited to warranties of accuracy or implied warranties of merchantability or fitness for a particular purpose. Use of the data is at the user’s sole risk. In no event will Freddie Mac be liable for any damages arising out of or related to the data, including but not limited to direct, indirect, incidental, special, consequential, or punitive damages, whether under a contract, tort, or any other theory of liability, even if Freddie Mac is aware of the possibility of such damages.
Copyright, 2016, Freddie Mac. Reprinted with permission. |
 |
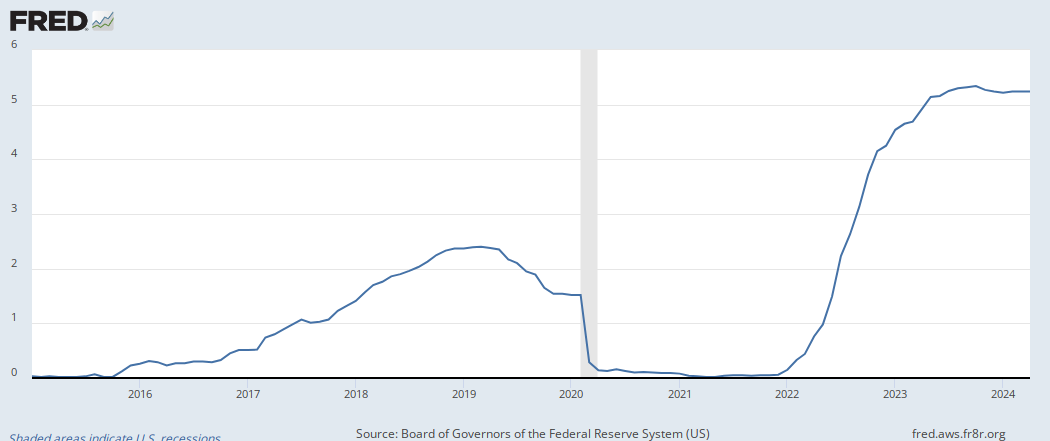
Interest Rate on Reserve Balances
| 2024-04-18 / Daily, 7-Day / Percent
Starting July 29, 2021, the interest rate on excess reserves (IOER (https://fred.stlouisfed.org/series/IOER)) and the interest rate on required reserves (IORR (https://fred.stlouisfed.org/series/IORR)) were replaced with a single rate, the interest rate on reserve balances (IORB (https://fred.stlouisfed.org/series/IORB)). See the source's announcement (https://www.federalreserve.gov/newsevents/pressreleases/bcreg20210602a.htm) for more details.
The interest rate on reserve balances (IORB rate) is the rate of interest that the Federal Reserve pays on balances maintained by or on behalf of eligible institutions in master accounts at Federal Reserve Banks. The interest rate is set by the Board of Governors, and it is an important tool of monetary policy.
See Policy Tools (https://www.federalreserve.gov/monetarypolicy/reqresbalances.htm) and the IORB FAQs (https://www.federalreserve.gov/monetarypolicy/iorb-faqs.htm) for more information. |
 |