| Market Hotness: Page View Count per Property in Carver County, MN |
| 2025-02-21 10:31:38-06 / Monthly / Percent Change from Year Ago |  |
| The percentage change in average page view counts on realtor.com from the same month in the previous year. With the release of its November 2021 housing trends report, Realtor.com® incorporated a new and improved methodology for capturing and reporting housing inventory trends and metrics. The new methodology uses the latest and most accurate data mapping of listing statuses to yield a cleaner and more consistent measurement of active listings at both the national and local level. The methodology has also been adjusted to better account for missing data in some fields including square footage. Most areas across the country will see minor changes with a smaller handful of areas seeing larger updates. As a result of these changes, the data released since December 2021 will not be directly comparable with previous data releases (files downloaded before December 2021) and Realtor.com® economics blog posts. However, future data releases, including historical data, will consistently apply the new methodology. More details are available at the source's Real Estate Data Library (https://www.realtor.com/research/data/). |
| Market Hotness: Listing Views per Property in Rice County, MN |
| 2025-02-21 10:31:38-06 / Monthly / Percent Change from Year Ago |  |
| The percentage change in average page view counts on realtor.com from the same month in the previous year. With the release of its November 2021 housing trends report, Realtor.com® incorporated a new and improved methodology for capturing and reporting housing inventory trends and metrics. The new methodology uses the latest and most accurate data mapping of listing statuses to yield a cleaner and more consistent measurement of active listings at both the national and local level. The methodology has also been adjusted to better account for missing data in some fields including square footage. Most areas across the country will see minor changes with a smaller handful of areas seeing larger updates. As a result of these changes, the data released since December 2021 will not be directly comparable with previous data releases (files downloaded before December 2021) and Realtor.com® economics blog posts. However, future data releases, including historical data, will consistently apply the new methodology. More details are available at the source's Real Estate Data Library (https://www.realtor.com/research/data/). |
| Market Hotness: Page View Count per Property in Sherburne County, MN |
| 2025-02-21 10:31:38-06 / Monthly / Percent Change from Year Ago |  |
| The percentage change in average page view counts on realtor.com from the same month in the previous year. With the release of its November 2021 housing trends report, Realtor.com® incorporated a new and improved methodology for capturing and reporting housing inventory trends and metrics. The new methodology uses the latest and most accurate data mapping of listing statuses to yield a cleaner and more consistent measurement of active listings at both the national and local level. The methodology has also been adjusted to better account for missing data in some fields including square footage. Most areas across the country will see minor changes with a smaller handful of areas seeing larger updates. As a result of these changes, the data released since December 2021 will not be directly comparable with previous data releases (files downloaded before December 2021) and Realtor.com® economics blog posts. However, future data releases, including historical data, will consistently apply the new methodology. More details are available at the source's Real Estate Data Library (https://www.realtor.com/research/data/). |
| Market Hotness: Listing Views per Property in Fargo, ND-MN (CBSA) |
| 2025-02-21 10:31:33-06 / Monthly / Percent Change |  |
| The percentage change in average page view counts on realtor.com from the previous month. With the release of its November 2021 housing trends report, Realtor.com® incorporated a new and improved methodology for capturing and reporting housing inventory trends and metrics. The new methodology uses the latest and most accurate data mapping of listing statuses to yield a cleaner and more consistent measurement of active listings at both the national and local level. The methodology has also been adjusted to better account for missing data in some fields including square footage. Most areas across the country will see minor changes with a smaller handful of areas seeing larger updates. As a result of these changes, the data released since December 2021 will not be directly comparable with previous data releases (files downloaded before December 2021) and Realtor.com® economics blog posts. However, future data releases, including historical data, will consistently apply the new methodology. More details are available at the source's Real Estate Data Library (https://www.realtor.com/research/data/). |
| Market Hotness: Page View Count per Property in La Crosse-Onalaska, WI-MN (CBSA) |
| 2025-02-21 10:31:33-06 / Monthly / Percent Change |  |
| The percentage change in average page view counts on realtor.com from the previous month. With the release of its November 2021 housing trends report, Realtor.com® incorporated a new and improved methodology for capturing and reporting housing inventory trends and metrics. The new methodology uses the latest and most accurate data mapping of listing statuses to yield a cleaner and more consistent measurement of active listings at both the national and local level. The methodology has also been adjusted to better account for missing data in some fields including square footage. Most areas across the country will see minor changes with a smaller handful of areas seeing larger updates. As a result of these changes, the data released since December 2021 will not be directly comparable with previous data releases (files downloaded before December 2021) and Realtor.com® economics blog posts. However, future data releases, including historical data, will consistently apply the new methodology. More details are available at the source's Real Estate Data Library (https://www.realtor.com/research/data/). |
| Market Hotness: Hotness Rank in La Crosse-Onalaska, WI-MN (CBSA) |
| 2025-02-21 10:31:25-06 / Monthly / Rank Change from Year Ago |  |
| Market hotness rank for the specified zip code, county, or metro area's compared to all other zip codes, counties and metro areas nationally. A rank value of 1 is considered the hottest in the country. The change in Hotness rank from the previous year. A positive value indicates a market has cooled down (moved down in ranking), and a negative value indicates a market has heated up (moved up in ranking). With the release of its November 2021 housing trends report, Realtor.com® incorporated a new and improved methodology for capturing and reporting housing inventory trends and metrics. The new methodology uses the latest and most accurate data mapping of listing statuses to yield a cleaner and more consistent measurement of active listings at both the national and local level. The methodology has also been adjusted to better account for missing data in some fields including square footage. Most areas across the country will see minor changes with a smaller handful of areas seeing larger updates. As a result of these changes, the data released since December 2021 will not be directly comparable with previous data releases (files downloaded before December 2021) and Realtor.com® economics blog posts. However, future data releases, including historical data, will consistently apply the new methodology. More details are available at the source's Real Estate Data Library (https://www.realtor.com/research/data/). |
| Market Hotness: Hotness Rank in Duluth, MN-WI (CBSA) |
| 2025-02-21 10:31:24-06 / Monthly / Rank Change from Year Ago |  |
| Market hotness rank for the specified zip code, county, or metro area's compared to all other zip codes, counties and metro areas nationally. A rank value of 1 is considered the hottest in the country. The change in Hotness rank from the previous year. A positive value indicates a market has cooled down (moved down in ranking), and a negative value indicates a market has heated up (moved up in ranking). With the release of its November 2021 housing trends report, Realtor.com® incorporated a new and improved methodology for capturing and reporting housing inventory trends and metrics. The new methodology uses the latest and most accurate data mapping of listing statuses to yield a cleaner and more consistent measurement of active listings at both the national and local level. The methodology has also been adjusted to better account for missing data in some fields including square footage. Most areas across the country will see minor changes with a smaller handful of areas seeing larger updates. As a result of these changes, the data released since December 2021 will not be directly comparable with previous data releases (files downloaded before December 2021) and Realtor.com® economics blog posts. However, future data releases, including historical data, will consistently apply the new methodology. More details are available at the source's Real Estate Data Library (https://www.realtor.com/research/data/). |
| Market Hotness: Hotness Rank in Sherburne County, MN |
| 2025-02-21 10:31:22-06 / Monthly / Rank Change from Year Ago |  |
| Market hotness rank for the specified zip code, county, or metro area's compared to all other zip codes, counties and metro areas nationally. A rank value of 1 is considered the hottest in the country. The change in Hotness rank from the previous year. A positive value indicates a market has cooled down (moved down in ranking), and a negative value indicates a market has heated up (moved up in ranking). With the release of its November 2021 housing trends report, Realtor.com® incorporated a new and improved methodology for capturing and reporting housing inventory trends and metrics. The new methodology uses the latest and most accurate data mapping of listing statuses to yield a cleaner and more consistent measurement of active listings at both the national and local level. The methodology has also been adjusted to better account for missing data in some fields including square footage. Most areas across the country will see minor changes with a smaller handful of areas seeing larger updates. As a result of these changes, the data released since December 2021 will not be directly comparable with previous data releases (files downloaded before December 2021) and Realtor.com® economics blog posts. However, future data releases, including historical data, will consistently apply the new methodology. More details are available at the source's Real Estate Data Library (https://www.realtor.com/research/data/). |
| Market Hotness: Hotness Rank in La Crosse-Onalaska, WI-MN (CBSA) |
| 2025-02-21 10:31:21-06 / Monthly / Rank |  |
| Market hotness rank for the specified zip code, county, or metro area's compared to all other zip codes, counties and metro areas nationally. A rank value of 1 is considered the hottest in the country. With the release of its November 2021 housing trends report, Realtor.com® incorporated a new and improved methodology for capturing and reporting housing inventory trends and metrics. The new methodology uses the latest and most accurate data mapping of listing statuses to yield a cleaner and more consistent measurement of active listings at both the national and local level. The methodology has also been adjusted to better account for missing data in some fields including square footage. Most areas across the country will see minor changes with a smaller handful of areas seeing larger updates. As a result of these changes, the data released since December 2021 will not be directly comparable with previous data releases (files downloaded before December 2021) and Realtor.com® economics blog posts. However, future data releases, including historical data, will consistently apply the new methodology. More details are available at the source's Real Estate Data Library (https://www.realtor.com/research/data/). |
| Market Hotness: Hotness Rank in La Crosse-Onalaska, WI-MN (CBSA) |
| 2025-02-21 10:31:20-06 / Monthly / Rank Change |  |
| Market hotness rank for the specified zip code, county, or metro area's compared to all other zip codes, counties and metro areas nationally. A rank value of 1 is considered the hottest in the country. The change in Hotness rank from the previous month. A positive value indicates a market has cooled down (moved down in ranking), and a negative value indicates a market has heated up (moved up in ranking). With the release of its November 2021 housing trends report, Realtor.com® incorporated a new and improved methodology for capturing and reporting housing inventory trends and metrics. The new methodology uses the latest and most accurate data mapping of listing statuses to yield a cleaner and more consistent measurement of active listings at both the national and local level. The methodology has also been adjusted to better account for missing data in some fields including square footage. Most areas across the country will see minor changes with a smaller handful of areas seeing larger updates. As a result of these changes, the data released since December 2021 will not be directly comparable with previous data releases (files downloaded before December 2021) and Realtor.com® economics blog posts. However, future data releases, including historical data, will consistently apply the new methodology. More details are available at the source's Real Estate Data Library (https://www.realtor.com/research/data/). |
| All-Transactions House Price Index for Minnesota |
| 2024-07-01 / Quarterly / Index 1980:Q1=100 |  |
| Estimated using sales prices and appraisal data. |
| State Minimum Wage Rate for Minnesota |
| 2025-01-01 / Annual / Dollars per Hour |  |
| State minimum wage applies only after a certain level of gross annual sales or receipts is reached by the employer. For more information, visit https://www.dol.gov/whd/state/stateMinWageHis.htm |
| S&P CoreLogic Case-Shiller MN-Minneapolis Home Price Index |
| 2024-11-01 / Monthly / Index Jan 2000=100 |  |
| For more information regarding the index, please visit Standard & Poor's (https://www.spglobal.com/spdji/en/documents/methodologies/methodology-sp-corelogic-cs-home-price-indices.pdf). Copyright © 2016, S&P Dow Jones Indices LLC. All rights reserved. Reproduction of Home Price Index for Minneapolis, Minnesota in any form is prohibited except with the prior written permission of S&P Dow Jones Indices LLC "S&P". S&P does not guarantee the accuracy, adequacy, completeness or availability of any information and is not responsible for any errors or omissions, regardless of the cause or for the results obtained from the use of such information. S&P DISCLAIMS ANY AND ALL EXPRESS OR IMPLIED WARRANTIES, INCLUDING, BUT NOT LIMITED TO, ANY WARRANTIES OF MERCHANTABILITY OR FITNESS FOR A PARTICULAR PURPOSE OR USE. In no event shall S&P be liable for any direct, indirect, special or consequential damages, costs, expenses, legal fees, or losses (including lost income or lost profit and opportunity costs) in connection with subscriber's or others' user of Home Price Index for Minneapolis, Minnesota. Permission to reproduce this series can be requested from [email protected]. More contact details are available from http://us.spindices.com/contact-us/, including phone numbers for all of its regional offices. |
| All-Transactions House Price Index for Minneapolis-St. Paul-Bloomington, MN-WI (MSA) |
| 2024-07-01 / Quarterly / Index 1995:Q1=100 |  |
| Estimated using sales prices and appraisal data. |
| Real Median Household Income in Minnesota |
| 2023-01-01 / Annual / 2023 C-CPI-U Dollars |  |
| Income in 2023 C-CPI-U (2000-2023) and R-CPI-U-RS (pre-2000) adjusted dollars. |
| Unemployment Rate in Minnesota |
| 2024-12-01 / Monthly / Percent |  |
| Housing Inventory: Active Listing Count in Minneapolis-ST. Paul-Bloomington, MN-WI (CBSA) |
| 2025-01-01 / Monthly / Level |  |
| The count of active single-family and condo/townhome listings for a given market during the specified month (excludes pending listings). With the release of its September 2022 housing trends report, Realtor.com® incorporated a new and improved methodology for capturing and reporting housing inventory trends and metrics. The new methodology updates and improves the calculation of time on market and improves handling of duplicate listings. Most areas across the country will see minor changes with a smaller handful of areas seeing larger updates. As a result of these changes, the data released since October 2022 will not be directly comparable with previous data releases (files downloaded before October 2022) and Realtor.com® economics blog posts. However, future data releases, including historical data, will consistently apply the new methodology. More details are available at the source's Real Estate Data Library (https://www.realtor.com/research/data/). With the release of its November 2021 housing trends report, Realtor.com® incorporated a new and improved methodology for capturing and reporting housing inventory trends and metrics. The new methodology uses the latest and most accurate data mapping of listing statuses to yield a cleaner and more consistent measurement of active listings at both the national and local level. The methodology has also been adjusted to better account for missing data in some fields including square footage. Most areas across the country will see minor changes with a smaller handful of areas seeing larger updates. As a result of these changes, the data released since December 2021 will not be directly comparable with previous data releases (files downloaded before December 2021) and Realtor.com® economics blog posts. However, future data releases, including historical data, will consistently apply the new methodology. More details are available at the source's Real Estate Data Library (https://www.realtor.com/research/data/). |
| Total Gross Domestic Product for Minneapolis-St. Paul-Bloomington, MN-WI (MSA) |
| 2023-01-01 / Annual / Millions of Dollars |  |
| The All industry total includes all Private industries and Government. Gross domestic product (GDP) by metropolitan area is the measure of the market value of all final goods and services produced within a metropolitan area in a particular period of time. In concept, an industry's GDP by metropolitan area, referred to as its "value added", is equivalent to its gross output (sales or receipts and other operating income, commodity taxes, and inventory change) minus its intermediate inputs (consumption of goods and services purchased from other U.S. industries or imported). GDP by metropolitan area is the metropolitan area counterpart of the nation's, BEA's featured measure of U.S. production. For more information about this release go to http://www.bea.gov/newsreleases/regional/gdp_metro/gdp_metro_newsrelease.htm. |
| Resident Population in Minneapolis-St. Paul-Bloomington, MN-WI (MSA) |
| 2023-01-01 / Annual / Thousands of Persons |  |
| All observations are July 1 estimates of each year. |
| Unemployment Rate in Minneapolis-St. Paul-Bloomington, MN-WI (MSA) |
| 2024-12-01 / Monthly / Percent |  |
| All-Transactions House Price Index for Minnesota |
| 2024-07-01 / Quarterly / Index 1980:Q1=100 | |
| State Minimum Wage Rate for Minnesota |
| 2025-01-01 / Annual / Dollars per Hour | |
| Unemployment Rate in Minnesota |
| 2024-12-01 / Monthly / Percent | |
| Real Median Household Income in Minnesota |
| 2023-01-01 / Annual / 2023 C-CPI-U Dollars | |
| Gross Domestic Product: All Industry Total in Minnesota |
| 2023-01-01 / Annual / Millions of Dollars |  |
| Housing Inventory: Active Listing Count in Minnesota |
| 2025-01-01 / Monthly / Level |  |
| Rental Vacancy Rate for Minnesota |
| 2023-01-01 / Annual / Percent |  |
| Median Household Income in Minnesota |
| 2023-01-01 / Annual / Current Dollars |  |
| Labor Force Participation Rate for Minnesota |
| 2024-12-01 / Monthly / Percent |  |
| Resident Population in Minnesota |
| 2024-01-01 / Annual / Thousands of Persons |  |
| Per Capita Personal Income in Minnesota |
| 2023-01-01 / Annual / Dollars |  |
| New Private Housing Units Authorized by Building Permits: 1-Unit Structures for Minnesota |
| 2024-12-01 / Monthly / Units |  |
| Homeownership Rate for Minnesota |
| 2023-01-01 / Annual / Percent |  |
| Continued Claims (Insured Unemployment) in Minnesota |
| 2025-02-08 / Weekly / Number |  |
| Housing Inventory: Median Listing Price per Square Feet in Minnesota |
| 2025-01-01 / Monthly / U.S. Dollars |  |
| Real Gross Domestic Product: All Industry Total in Minnesota |
| 2024-07-01 / Quarterly / Millions of Chained 2017 Dollars |  |
| Pandemic Unemployment Assistance Initial Claims in Minnesota |
| 2022-11-05 / Weekly / Number |  |
| Initial Claims in Minnesota |
| 2025-02-15 / Weekly / Number |  |
| All Employees: Total Nonfarm in Minnesota |
| 2024-12-01 / Monthly / Thousands of Persons |  |
| Average Hourly Earnings of All Employees: Total Private in Minnesota (DISCONTINUED) |
| 2022-03-01 / Monthly / Dollars per Hour |  |
| Bachelor's Degree or Higher for Minnesota |
| 2023-01-01 / Annual / Percent |  |
| SNAP Benefits Recipients in Minnesota |
| 2023-06-01 / Monthly / Persons | 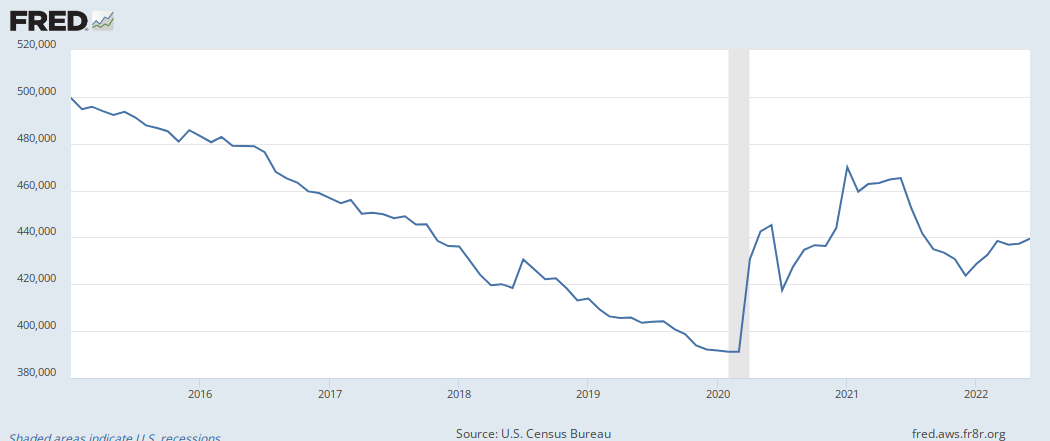 |
| State Tax Collections: Total Taxes for Minnesota |
| 2024-07-01 / Quarterly / Millions of U.S. Dollars |  |
| Chain-Type Quantity Index for Real GDP: Mining (Except Oil and Gas) (212) in Minnesota |
| 2023-01-01 / Annual / Index 2017=100 |  |
| Zillow Home Value Index (ZHVI) for All Homes Including Single-Family Residences, Condos, and CO-OPs in Minnesota |
| 2025-01-01 / Monthly / Dollars |  |
| Average Hourly Earnings of Production Employees: Manufacturing: Durable Goods in Minnesota |
| 2023-01-01 / Annual / Dollars per Hour |  |
| New Private Housing Units Authorized by Building Permits for Minnesota |
| 2024-12-01 / Monthly / Units |  |
| Average Hourly Earnings of Production Employees: Leisure and Hospitality: Food Services and Drinking Places in Minnesota (DISCONTINUED) |
| 2022-03-01 / Monthly / Dollars per Hour |  |
| Home Vacancy Rate for Minnesota |
| 2023-01-01 / Annual / Percent |  |
| Real Gross Domestic Product: Support Activities for Mining (213) in Minnesota |
| 2023-01-01 / Annual / Millions of Chained 2017 Dollars |  |
| Personal Consumption Expenditures: Total for Minnesota |
| 2023-01-01 / Annual / Millions of Dollars |  |
| Real Gross Domestic Product: Rail Transportation (482) in Minnesota |
| 2023-01-01 / Annual / Millions of Chained 2017 Dollars |  |
| Gross Domestic Product: Utilities (22) in Minnesota |
| 2024-07-01 / Quarterly / Millions of Dollars |  |
| Housing Inventory: Median Listing Price in Minnesota |
| 2025-01-01 / Monthly / U.S. Dollars |  |
| S&P CoreLogic Case-Shiller MN-Minneapolis Home Price Index |
| 2024-11-01 / Monthly / Index Jan 2000=100 | |
| Civilian Labor Force in Minnesota |
| 2024-12-01 / Monthly / Persons |  |
| Unemployment Rate in Hennepin County, MN |
| 2024-12-01 / Monthly / Percent |  |
| U.S. Granted Patents: Total Patents Originating in Minnesota |
| 2020-01-01 / Annual / Number |  |
| Mean Adjusted Gross Income for Minnesota |
| 2021-01-01 / Annual / Dollars |  |
| Average Weekly Earnings of All Employees: Construction in Minnesota |
| 2023-01-01 / Annual / Dollars per Week |  |