| Business Applications with Planned Wages for Minnesota |
| 2024-04-18 11:03:23-05 / Weekly, Ending Saturday / Number | 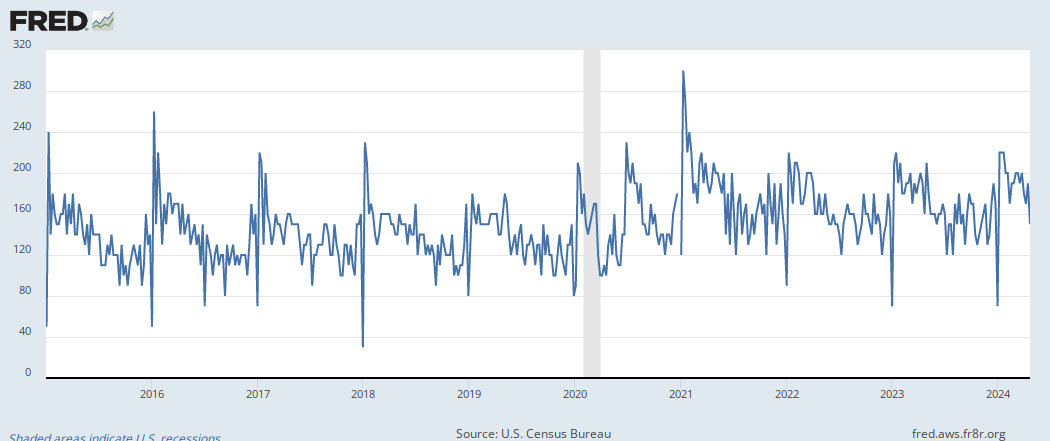 |
| Business Applications with Planned Wages (WBA): A subset of High-Propensity Business Applications (HBA) that contains all applications that indicate a planned date for paying wages. See "About the Data" (https://www.census.gov/econ/bfs/about_the_data.html) for more details. |
| High-Propensity Business Applications for Minnesota |
| 2024-04-18 11:03:22-05 / Weekly, Ending Saturday / Number |  |
| High-Propensity Business Applications (HBA): A subset of Business Applications (BA) that contains all applications with a high-propensity of turning into a business with a payroll, based on various factors. See "About the Data" (https://www.census.gov/econ/bfs/about_the_data.html) for more details. |
| Business Applications with Planned Wages for Minnesota |
| 2024-04-18 11:03:19-05 / Weekly, Ending Saturday / Percent Change from Year Ago |  |
| Business Applications with Planned Wages (WBA): A subset of High-Propensity Business Applications (HBA) that contains all applications that indicate a planned date for paying wages. See "About the Data" (https://www.census.gov/econ/bfs/about_the_data.html) for more details. |
| Business Applications for Minnesota |
| 2024-04-18 11:03:06-05 / Weekly, Ending Saturday / Number |  |
| Business Applications (BA): The core business applications series that corresponds to a subset of all EIN applications. BA includes all applications for an EIN, except for applications for tax liens, estates, trusts, or certain financial filings, applications with no state-county geocodes, applications from certain agricultural, public entities, and applications in certain industries (e.g. private households, civic and social organizations). See "About the Data" (https://www.census.gov/econ/bfs/about_the_data.html) for more details. |
| High-Propensity Business Applications for Minnesota |
| 2024-04-18 11:02:52-05 / Weekly, Ending Saturday / Percent Change from Year Ago |  |
| High-Propensity Business Applications (HBA): A subset of Business Applications (BA) that contains all applications with a high-propensity of turning into a business with a payroll, based on various factors. See "About the Data" (https://www.census.gov/econ/bfs/about_the_data.html) for more details. |
| Business Applications from Corporations for Minnesota |
| 2024-04-18 11:02:40-05 / Weekly, Ending Saturday / Number |  |
| Business Applications from Corporations (CBA): A subset of High-Propensity Business Applications (HBA) that contains all applications that come from a corporation or a personal service corporation. See "About the Data" (https://www.census.gov/econ/bfs/about_the_data.html) for more details. |
| Business Applications for Minnesota |
| 2024-04-18 11:02:37-05 / Weekly, Ending Saturday / Percent Change from Year Ago |  |
| Business Applications (BA): The core business applications series that corresponds to a subset of all EIN applications. BA includes all applications for an EIN, except for applications for tax liens, estates, trusts, or certain financial filings, applications with no state-county geocodes, applications from certain agricultural, public entities, and applications in certain industries (e.g. private households, civic and social organizations). See "About the Data" (https://www.census.gov/econ/bfs/about_the_data.html) for more details. |
| Business Applications from Corporations for Minnesota |
| 2024-04-18 11:01:55-05 / Weekly, Ending Saturday / Percent Change from Year Ago |  |
| Business Applications from Corporations (CBA): A subset of High-Propensity Business Applications (HBA) that contains all applications that come from a corporation or a personal service corporation. See "About the Data" (https://www.census.gov/econ/bfs/about_the_data.html) for more details. |
| Zillow Home Value Index (ZHVI) for All Homes Including Single-Family Residences, Condos, and CO-OPs in Minnesota |
| 2024-04-18 03:31:08-05 / Monthly / Dollars |  |
| The Zillow Home Value Index or ZHVI is a smoothed, seasonally adjusted measure of the typical home value and market changes across a given region and housing type. It reflects the typical value for homes in the 35th to 65th percentile range. Home types captured in ZHVI include single-family residences, condos, and co-ops. A single-family home is a standalone, detached house used as a single dwelling unit, meaning a residence for one family, person or household. It has its own private entrance and direct street access, and is built on its own land, usually with additional yard space. An owner-occupied apartment is generally referred to as a condominium or condo. The public common areas are jointly-owned and usually managed by a homeowners association (HOA). A cooperative, or co-op, is a type of housing that is actually a corporation. A co-op resembles a condominium but the unit owners do not own their unit outright. Each resident owns a share in a corporation that entitles them to live in one of the units under a lease agreement. For more information on types of houses, check out Zillow's types of houses article (https://www.zillow.com/resources/stay-informed/types-of-houses/). For information about ZHVI, check out their user guide (https://www.zillow.com/research/zhvi-user-guide/). For more information about methodology check out this overview of ZHVI (https://www.zillow.com/research/zhvi-methodology-2019-highlights-26221/) and a deep-dive into its methodology (https://www.zillow.com/research/zhvi-methodology-2019-deep-26226/). |
| Job Postings on Indeed in Minnesota |
| 2024-04-16 09:03:32-05 / Daily, 7-Day / Index Feb, 1 2020=100 |  |
| Indeed calculates the index change in seasonally-adjusted job postings since February 1, 2020, the pre-pandemic baseline. Indeed seasonally adjusts each series based on historical patterns in 2017, 2018, and 2019. Each series, including the national trend, occupational sectors, and sub-national geographies, is seasonally adjusted separately. Indeed switched to this new methodology in December 2022 and now reports all historical data using this new methodology. Historical numbers have been revised and may differ significantly from originally reported values. The new methodology applies a detrended seasonal adjustment factor to the index change in job postings. For more information, see Frequently Asked Questions (https://www.hiringlab.org/indeed-data-faq/) regarding Indeed Data. Copyrighted: Pre-approval required. Contact Indeed to request permission to use the data at their contact information provided here (https://github.com/hiring-lab/data#readme). End Users are excluded of any warranty and liability on the part of Indeed for the accuracy of the Indeed Data. End Users will refrain from any external distribution of Indeed Data except in oral or written presentations, provided that such portions or derivations are incidental to and supportive of such presentations and, provided further that the End Users shall not distribute or disseminate in such presentations any amount of Indeed Data which could cause such presentations to be susceptible to use substantially as a source of, or substitute for Indeed Data. End Users agree to credit Indeed as the source and owner of the Indeed Data when making it available to third parties in any permissible manner as well as in internal use. End Users agree to not sell or otherwise provide the Indeed Data obtained from Licensee to third parties. |
| All-Transactions House Price Index for Minnesota |
| 2023-10-01 / Quarterly / Index 1980:Q1=100 |  |
| Estimated using sales prices and appraisal data. |
| State Minimum Wage Rate for Minnesota |
| 2024-01-01 / Annual / Dollars per Hour |  |
| State minimum wage applies only after a certain level of gross annual sales or receipts is reached by the employer. For more information, visit https://www.dol.gov/whd/state/stateMinWageHis.htm |
| S&P CoreLogic Case-Shiller MN-Minneapolis Home Price Index |
| 2024-01-01 / Monthly / Index Jan 2000=100 |  |
| For more information regarding the index, please visit Standard & Poor's (https://www.spglobal.com/spdji/en/documents/methodologies/methodology-sp-corelogic-cs-home-price-indices.pdf). Copyright © 2016, S&P Dow Jones Indices LLC. All rights reserved. Reproduction of Home Price Index for Minneapolis, Minnesota in any form is prohibited except with the prior written permission of S&P Dow Jones Indices LLC "S&P". S&P does not guarantee the accuracy, adequacy, completeness or availability of any information and is not responsible for any errors or omissions, regardless of the cause or for the results obtained from the use of such information. S&P DISCLAIMS ANY AND ALL EXPRESS OR IMPLIED WARRANTIES, INCLUDING, BUT NOT LIMITED TO, ANY WARRANTIES OF MERCHANTABILITY OR FITNESS FOR A PARTICULAR PURPOSE OR USE. In no event shall S&P be liable for any direct, indirect, special or consequential damages, costs, expenses, legal fees, or losses (including lost income or lost profit and opportunity costs) in connection with subscriber's or others' user of Home Price Index for Minneapolis, Minnesota. Permission to reproduce this series can be requested from [email protected]. More contact details are available from http://us.spindices.com/contact-us/, including phone numbers for all of its regional offices. |
| All-Transactions House Price Index for Minneapolis-St. Paul-Bloomington, MN-WI (MSA) |
| 2023-10-01 / Quarterly / Index 1995:Q1=100 |  |
| Estimated using sales prices and appraisal data. |
| Real Median Household Income in Minnesota |
| 2022-01-01 / Annual / 2022 CPI-U-RS Adjusted Dollars |  |
| Household data are collected as of March. Consumer Price Index research series using current methods (CPI-U-RS) presents an estimate of the CPI for all Urban Consumers (CPI-U) that incorporates most of the improvements made over that time span into the entire series. More information can be found at https://www.bls.gov/cpi/research-series/home.htm. As stated in the Census's "Source and Accuracy of Estimates for Income, Poverty, and Health Insurance Coverage in the United States: 2011" (http://www.census.gov/hhes/www/p60_243sa.pdf): Estimation of Median Incomes. The Census Bureau has changed the methodology for computing median income over time. The Census Bureau has computed medians using either Pareto interpolation or linear interpolation. Currently, we are using linear interpolation to estimate all medians. Pareto interpolation assumes a decreasing density of population within an income interval, whereas linear interpolation assumes a constant density of population within an income interval. The Census Bureau calculated estimates of median income and associated standard errors for 1979 through 1987 using Pareto interpolation if the estimate was larger than $20,000 for people or $40,000 for families and households. This is because the width of the income interval containing the estimate is greater than $2,500. We calculated estimates of median income and associated standard errors for 1976, 1977, and 1978 using Pareto interpolation if the estimate was larger than $12,000 for people or $18,000 for families and households. This is because the width of the income interval containing the estimate is greater than $1,000. All other estimates of median income and associated standard errors for 1976 through 2011 (2012 ASEC) and almost all of the estimates of median income and associated standard errors for 1975 and earlier were calculated using linear interpolation. Thus, use caution when comparing median incomes above $12,000 for people or $18,000 for families and households for different years. Median incomes below those levels are more comparable from year to year since they have always been calculated using linear interpolation. For an indication of the comparability of medians calculated using Pareto interpolation with medians calculated using linear interpolation, see Series P-60, Number 114, Money Income in 1976 of Families and Persons in the United States (www2.census.gov/prod2/popscan/p60-114.pdf). |
| Unemployment Rate in Minnesota |
| 2024-02-01 / Monthly / Percent |  |
| Housing Inventory: Active Listing Count in Minneapolis-ST. Paul-Bloomington, MN-WI (CBSA) |
| 2024-03-01 / Monthly / Level |  |
| The count of active single-family and condo/townhome listings for a given market during the specified month (excludes pending listings). With the release of its September 2022 housing trends report, Realtor.com® incorporated a new and improved methodology for capturing and reporting housing inventory trends and metrics. The new methodology updates and improves the calculation of time on market and improves handling of duplicate listings. Most areas across the country will see minor changes with a smaller handful of areas seeing larger updates. As a result of these changes, the data released since October 2022 will not be directly comparable with previous data releases (files downloaded before October 2022) and Realtor.com® economics blog posts. However, future data releases, including historical data, will consistently apply the new methodology. More details are available at the source's Real Estate Data Library (https://www.realtor.com/research/data/). With the release of its November 2021 housing trends report, Realtor.com® incorporated a new and improved methodology for capturing and reporting housing inventory trends and metrics. The new methodology uses the latest and most accurate data mapping of listing statuses to yield a cleaner and more consistent measurement of active listings at both the national and local level. The methodology has also been adjusted to better account for missing data in some fields including square footage. Most areas across the country will see minor changes with a smaller handful of areas seeing larger updates. As a result of these changes, the data released since December 2021 will not be directly comparable with previous data releases (files downloaded before December 2021) and Realtor.com® economics blog posts. However, future data releases, including historical data, will consistently apply the new methodology. More details are available at the source's Real Estate Data Library (https://www.realtor.com/research/data/). |
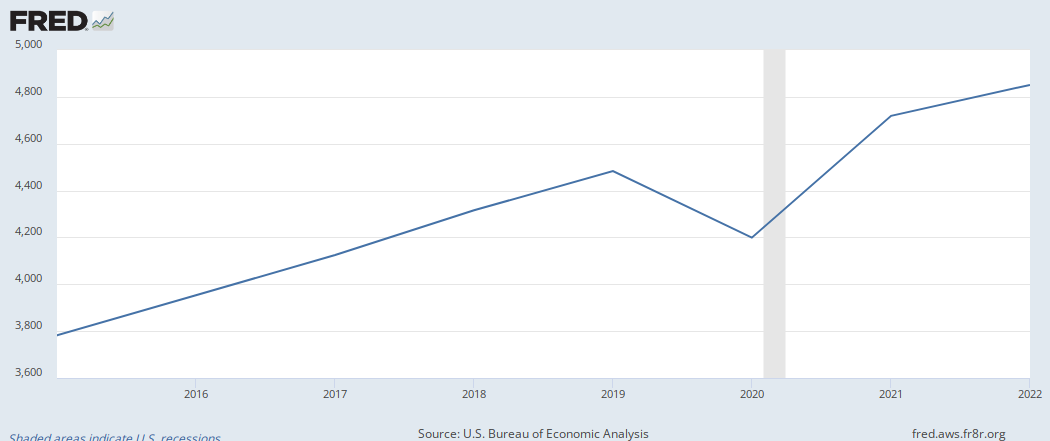
| Total Gross Domestic Product for Minneapolis-St. Paul-Bloomington, MN-WI (MSA) |
| 2022-01-01 / Annual / Millions of Dollars |  |
| The All industry total includes all Private industries and Government. Gross domestic product (GDP) by metropolitan area is the measure of the market value of all final goods and services produced within a metropolitan area in a particular period of time. In concept, an industry's GDP by metropolitan area, referred to as its "value added", is equivalent to its gross output (sales or receipts and other operating income, commodity taxes, and inventory change) minus its intermediate inputs (consumption of goods and services purchased from other U.S. industries or imported). GDP by metropolitan area is the metropolitan area counterpart of the nation's, BEA's featured measure of U.S. production. For more information about this release go to http://www.bea.gov/newsreleases/regional/gdp_metro/gdp_metro_newsrelease.htm. |
| Resident Population in Minneapolis-St. Paul-Bloomington, MN-WI (MSA) |
| 2023-01-01 / Annual / Thousands of Persons |  |
| All observations are July 1 estimates of each year. |
| Unemployment Rate in Minneapolis-St. Paul-Bloomington, MN-WI (MSA) |
| 2024-02-01 / Monthly / Percent |  |
| All-Transactions House Price Index for Minnesota |
| 2023-10-01 / Quarterly / Index 1980:Q1=100 | |
| State Minimum Wage Rate for Minnesota |
| 2024-01-01 / Annual / Dollars per Hour | |
| Unemployment Rate in Minnesota |
| 2024-02-01 / Monthly / Percent | |
| Real Median Household Income in Minnesota |
| 2022-01-01 / Annual / 2022 CPI-U-RS Adjusted Dollars | |
| Gross Domestic Product: All Industry Total in Minnesota |
| 2023-01-01 / Annual / Millions of Dollars |  |
| Housing Inventory: Active Listing Count in Minnesota |
| 2024-03-01 / Monthly / Level |  |
| Rental Vacancy Rate for Minnesota |
| 2023-01-01 / Annual / Percent |  |
| Labor Force Participation Rate for Minnesota |
| 2024-02-01 / Monthly / Percent |  |
| Per Capita Personal Income in Minnesota |
| 2023-01-01 / Annual / Dollars |  |
| New Private Housing Units Authorized by Building Permits: 1-Unit Structures for Minnesota |
| 2024-02-01 / Monthly / Units |  |
| Median Household Income in Minnesota |
| 2022-01-01 / Annual / Current Dollars |  |
| Resident Population in Minnesota |
| 2023-01-01 / Annual / Thousands of Persons |  |
| Housing Inventory: Median Listing Price per Square Feet in Minnesota |
| 2024-03-01 / Monthly / U.S. Dollars |  |
| Homeownership Rate for Minnesota |
| 2023-01-01 / Annual / Percent |  |
| Continued Claims (Insured Unemployment) in Minnesota |
| 2024-03-30 / Weekly / Number |  |
| Real Gross Domestic Product: All Industry Total in Minnesota |
| 2023-10-01 / Quarterly / Millions of Chained 2017 Dollars |  |
| Pandemic Unemployment Assistance Initial Claims in Minnesota |
| 2022-11-05 / Weekly / Number |  |
| Initial Claims in Minnesota |
| 2024-04-06 / Weekly / Number |  |
| SNAP Benefits Recipients in Minnesota |
| 2022-06-01 / Monthly / Persons | 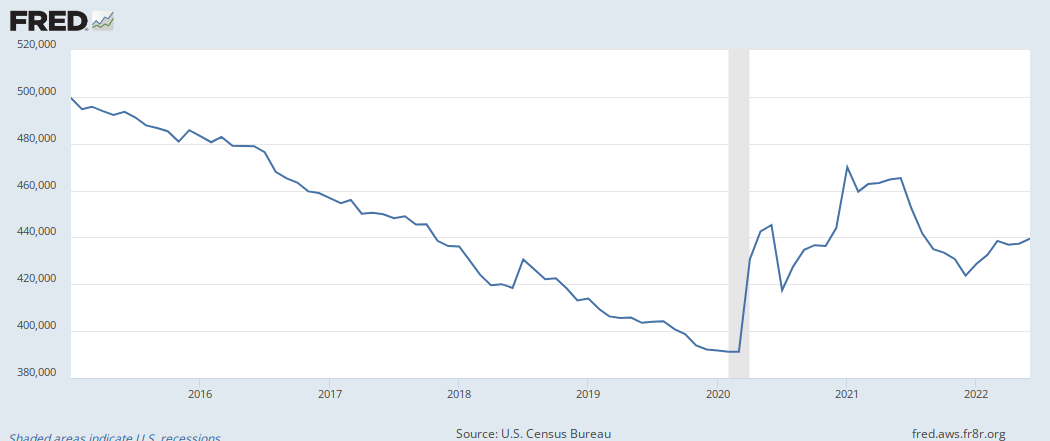 |
| All Employees: Total Nonfarm in Minnesota |
| 2024-02-01 / Monthly / Thousands of Persons |  |
| Average Hourly Earnings of All Employees: Total Private in Minnesota (DISCONTINUED) |
| 2022-03-01 / Monthly / Dollars per Hour |  |
| State Tax Collections: Total Taxes for Minnesota |
| 2023-10-01 / Quarterly / Millions of U.S. Dollars |  |
| Zillow Home Value Index (ZHVI) for All Homes Including Single-Family Residences, Condos, and CO-OPs in Minnesota |
| 2024-03-01 / Monthly / Dollars | |
| New Private Housing Units Authorized by Building Permits for Minnesota |
| 2024-02-01 / Monthly / Units |  |
| Average Hourly Earnings of Production Employees: Manufacturing: Durable Goods in Minnesota |
| 2023-01-01 / Annual / Dollars per Hour |  |
| Bachelor's Degree or Higher for Minnesota |
| 2022-01-01 / Annual / Percent |  |
| Real Gross Domestic Product: Support Activities for Mining (213) in Minnesota |
| 2022-01-01 / Annual / Millions of Chained 2017 Dollars |  |
| Gross Domestic Product: Support Activities for Mining (213) in Minnesota |
| 2022-01-01 / Annual / Millions of Dollars |  |
| Chain-Type Quantity Index for Real GDP: Textile Mills and Textile Product Mills (313-314) in Minnesota |
| 2022-01-01 / Annual / Index 2017=100 |  |
| Chain-Type Quantity Index for Real GDP: Mining (Except Oil and Gas) (212) in Minnesota |
| 2022-01-01 / Annual / Index 2017=100 |  |
| Real Gross Domestic Product: Rail Transportation (482) in Minnesota |
| 2022-01-01 / Annual / Millions of Chained 2017 Dollars |  |
| Real Gross Domestic Product: Textile Mills and Textile Product Mills (313-314) in Minnesota |
| 2022-01-01 / Annual / Millions of Chained 2017 Dollars |  |
| Per Capita Personal Consumption Expenditures: Services: Health Care for Minnesota |
| 2022-01-01 / Annual / Dollars |  |
| Per Capita Personal Consumption Expenditures: Services: Household Consumption Expenditures for Services for Minnesota |
| 2022-01-01 / Annual / Dollars |  |
| Per Capita Personal Consumption Expenditures: Nondurable Goods: Clothing and Footwear for Minnesota |
| 2022-01-01 / Annual / Dollars |  |

| Average Hourly Earnings of Production Employees: Leisure and Hospitality: Food Services and Drinking Places in Minnesota (DISCONTINUED) |
| 2022-03-01 / Monthly / Dollars per Hour |  |
| Housing Inventory: Median Listing Price in Minnesota |
| 2024-03-01 / Monthly / U.S. Dollars |  |
| Unemployment Level for Minnesota |
| 2023-10-01 / Quarterly / Persons, 4-Quarter Moving Average |  |